
The competition among phone companies is becoming increasingly fierce and the rates are turning into a maze: connection fees, discounts, VAT… navigating it is getting harder and harder, let alone finding the one that suits us best. Let’s try to get oriented with the help of Excel.

Add us to your preferred sources.

The competition among telephone companies is becoming increasingly fierce and the rates are turning into a labyrinth: connection fees, discounts, VAT… it’s becoming harder and harder to untangle, let alone find the one that suits us best. Let’s try to navigate thanks to Excel.
First of all, let’s analyze the composition of the cost of a phone call with the main telephone companies. In some cases, the tradition of the connection fee still survives; almost all provide a charge proportional to the duration of the call; some offer discounts for longer calls. All distinguish between local, national, calls to mobiles, and international calls. Let’s start gathering the information and sketching a scheme.

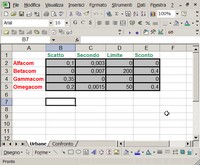
Let’s rename Sheet 1 to Urban (implied: Calls) and insert in column A the names of the different companies or different tariff plans. In the first row, instead, we insert the various items that make up the cost of the call: Connection fee, Second, Limit, Discount. In the first column we’ll insert the amount of the connection fee (if any), in the second the cost of one second (if the rate is not flat), in the third the minute from which the discount is applied, and in the fourth the related amount (if any).
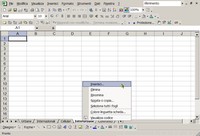
We can create, in an entirely similar way, a sheet for each category: National and International. Also, taking into account the partnerships between fixed and mobile telephone companies, we will need a page for the rates related to calls to mobiles from different companies. To add sheets we must right-click on the tabs at the bottom left and select Insert from the context menu.
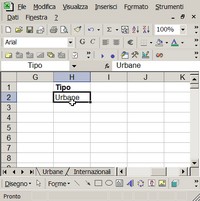
To perform the comparison between the different offers, let’s insert an additional sheet that we will call, in an enlightening way, Comparison. To choose the type of rate to examine, we write the name of the sheet that contains it in a cell (H2, in the example) which we will label as Type. To change the label of a cell (usually it coincides with its coordinates) just click in the box at the top right and type the new name that we can then use in formulas.
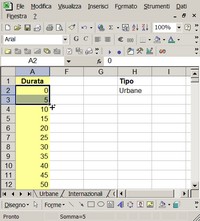
At this point, we need a Duration column which we will use to identify the moment when a rate stops being advantageous compared to the others. Let’s say we monitor the situation every 5 seconds. To automatically fill the column with values, we insert 0 in the first cell (A2), 5 in the second cell (A3), then select the pair of cells and drag down the column “pulling” the bottom right corner (the one with the “+” symbol).
Now let’s insert in the headers of the other columns the names of the telephone companies. We will use a formula to copy from the chosen sheet the correct row header: =INDIRECT(CONCATENATE(Type; “!A”; COLUMN())). With this formula we refer indirectly (i.e. via a string) to the cell belonging to the Type sheet, column A, and to the row equal to the column number of the cell where the formula is located. We copy this formula along the row: the headers will be inserted automatically.
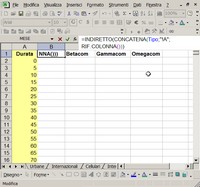
The formula to automatically calculate the cost of the call is long and intricate: INDIRECT(CONCATENATE(Type; “!B”; COLUMN())) + INDIRECT(CONCATENATE(Type; “!C”; COLUMN())) *
IF($A2 < INDIRECT(CONCATENATE(Type; "!D"; COLUMN())); $A2; INDIRECT(CONCATENATE(Type; "!D"; COLUMN())) +
(1 – INDIRECT(CONCATENATE(Type; "!E"; COLUMN()))) *
($A2 – INDIRECT(CONCATENATE(Type; "!D"; COLUMN()))))
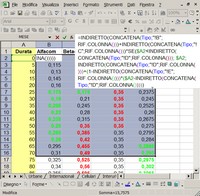
In practice, through this formula we want to write the cost of the call based on duration: cost = connection_fee + duration * cost_per_second. However, we must take into account the application of the discount: if the duration exceeds the limit, the cost of the call must be reduced. Alternatives to using this bulky formula are: resorting to a function written in VBA or inserting helper cells to store intermediate coefficients. Both are left to the readers’ discretion.
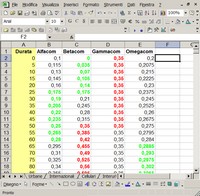
We copy the formula throughout the whole table of the Comparison sheet. We now have the cost of the call depending on the duration and the chosen telephone company. To highlight the most favorable rate at each moment we resort to conditional formatting: we want the best rate to be shown in green, the worst in red. We select the cells of the Comparison table and then, from the Format menu, choose Conditional Formatting.
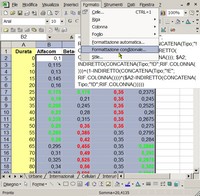
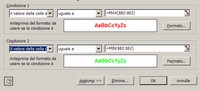
To highlight the best rates we use the condition “cell value is equal to =MAX($A2:$E2)” and choose green color from the Format dialog box under the Font tab. We add a condition using the Add button. To color the worst rates red, we select “cell value is equal to =MIN($A2:$E2)” and select the appropriate format. Clicking OK should quickly identify the company best suited to our needs.
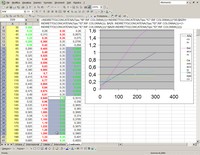
We would like, however, to have a support that is even more intuitive and quick to consult: a chart. We select the data area of the Comparison sheet and then, from the Insert menu, Chart. From the wizard we set the chart type to XY Scatter and at the end insert it in the same worksheet. The chart will update automatically as data changes, but if we want to add other columns (i.e. other telephone companies or new offers) we will have to rebuild it from scratch.
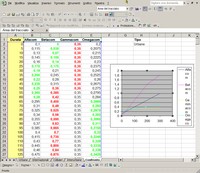
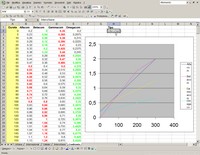
Reading the chart is very simple: for each zone you have to look for the line that is the lowest, which clearly corresponds to the most advantageous cost. Let’s observe an example related to four imaginary companies (the real ones already make too much publicity on their own). Even the tariffs and discounts are made up. Notice that some lines bend at a certain point: that’s where the discount comes into play decreasing the cost of the call.
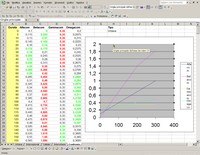
For very short calls, under thirty seconds, it is convenient to turn to Betacom (purple line in the chart) which does not require a connection fee. We note that this observation coincides with the points highlighted by conditional formatting in the table. For longer calls, between 30 and 60 seconds, the most convenient rate is offered by Alfacom (blue line in the chart). Again, our observations are supported by the numeric data.
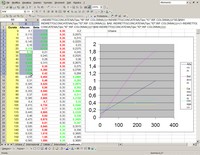
In the range between about 1 and 2 minutes, Omegacom (light blue line in the chart) has the most competitive rate. Clearly, in the long term, the flat-rate offer from Gammacom (indicated by the yellow line in the chart) wins. The graphical and numerical techniques allow us to decide which operator to choose before picking up the receiver based on an estimate of the call length we intend to make and by evaluating the extent of unforeseen events.
To study another type of call, simply change the Type cell in the Comparison sheet: the formulas contained inside, despite their cryptic nature, will automatically adapt and update the column headers and costs. This sheet alone does not allow you to choose a single operator for your calls: for that, you need to calculate the subscription cost and estimate the types of calls made based on the numbers dialed and call lengths.
Be the first to comment